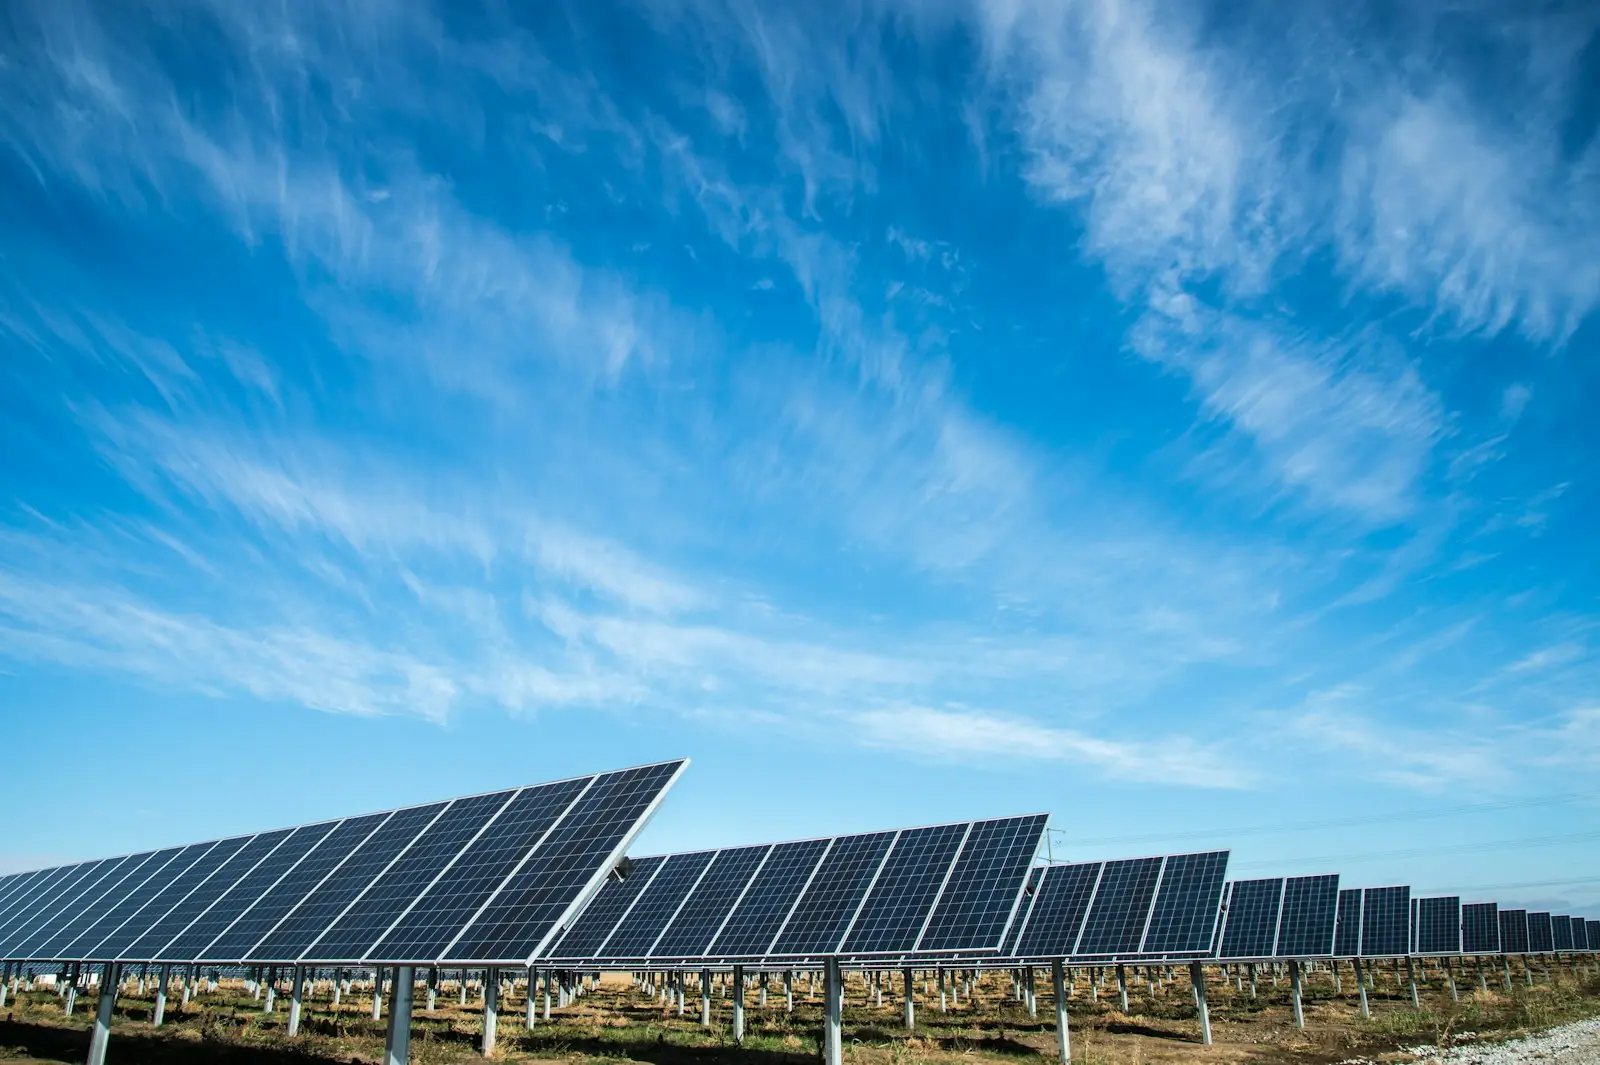
Satellite · Public example
Ariguaní: the solar resource is strong; grid access decides the next step
The Magdalena point scores 82.2/100 with full data coverage. Solar resource at 100 and terrain at 94 support the result, while grid at 54 and territorial context at 43 prevent an automatic go.
This is a real public example, not a generic client mission or a guarantee of results. Another site will not necessarily produce the same figures.
Key figures
- ›Result: 82.2/100 · favorable.
- ›GSA resource: 1,655 kWh/kWp/year · GHI 2,073.8 kWh/m²/year.
- ›Terrain: 0.8% average slope.
- ›Grid: line 8.1 km · substation 36.7 km.
1. Keep bottlenecks visible in the aggregate
A good aggregate prioritizes sites; it does not approve investment. Excellent resource cannot by itself offset remote or saturated connection, land constraints or a security context that raises development costs.
2. Use different sources for different questions
Global Solar Atlas and NASA POWER are not duplicates that must match exactly: they use different products, periods and variables. Their proximity supports the high-resource reading, while sizing needs a source and model defined by the engineer.
Copernicus GLO-30 models the slope. At screening scale it helps discard obviously complex terrain but does not replace design topography.
3. A simulation is only worth its assumptions
This chart does not estimate the site's total capacity or design a plant. Uncaptured energy, battery status and output follow the scenario's load and storage assumptions. Use it to teach assumption traceability, not to claim the site will produce 2,922 kWh/year whatever the project.
4. Add horizon and location context
A final context block gathers two checks: what relief may mask the sun and exactly where the point sits.
Grid remains the main uncertainty
The nearest listed transmission line is 8.1 km away and Copey 220 kV substation 36.7 km away. UPME records 13 projects totaling 969.2 MW within 50 km. This does not demonstrate spare capacity and may even signal competition for connection.
The right decision is not score is 82.2, build. It is:
- ›confirm ownership, land use and access;
- ›request a connection study with UPME and the operator, with target node and capacity;
- ›carry out topography, geotechnics and environmental review;
- ›define technology, power, losses and configuration before modeling output and economics.
What the screen lets you decide
The case justifies moving to a verification stage thanks to the resource and favorable modeled terrain, but places grid and context ahead of any capital commitment. The screen reduces initial uncertainty; it does not replace engineering or the connection.
Request this type of analysis
Related drone operations
Sources
Public PDFs sample-r3-solaire-co.{es,en,fr}.pdf, 20 pages, edition of 2026-07-17. ES figures from pages 2 to 5. The 2,922 kWh/year of the 10 kWp stand-alone scenario are not the site's total potential; listed grid distances and assigned capacities do not demonstrate available connection capacity, and DEM/horizon data are models to confirm on site.