Drone · Public example
Corasol: from flight to a report that lets you judge the result
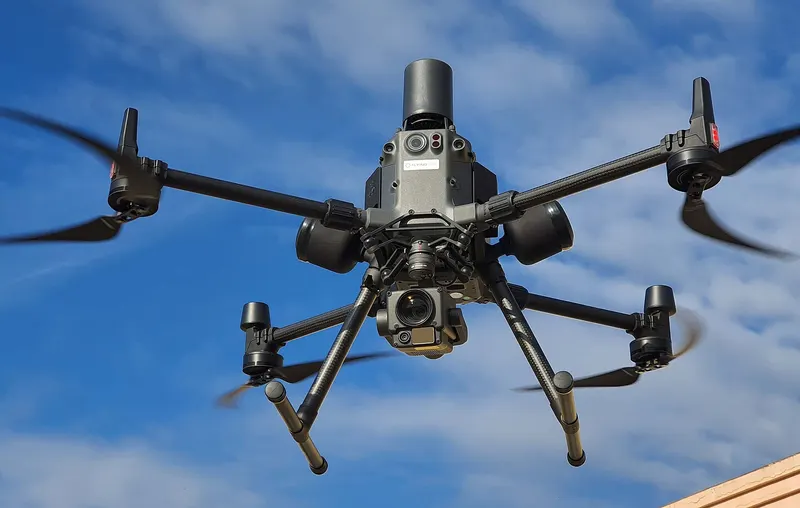
On June 28, 2026, a DJI Mini 5 Pro flew a mapping mission over Corasol. The useful story is not that a drone captured pictures. It is that the work can be followed from recorded path to produced files, with enough quality evidence to decide how the result may be used.
This is a real public example, not a generic client mission or a guarantee of results. Another site will not necessarily produce the same figures.
Key figures
- ›Flight: 15 min · 6.71 km · 102 m maximum altitude.
- ›Capture: 21/21 images calibrated.
- ›Reconstruction: 7.77 ha · WGS 84 / UTM 16N.
- ›Main output: 70.4 Mpx orthophoto · 5 cm/px.
1. Preserve flight intent
The first page locates the mission and preserves the planned route, departure and finish. It also identifies aircraft, duration, distance, altitude and related request, preventing the orthophoto from circulating without acquisition context.
2. Compare actual flight with the plan
The log shows 15 minutes, 6.71 km and 34 GNSS satellites on average. Its displayed flight footprint is 113 ha, while the reconstructed product covers 7.77 ha. Flight footprint and processed area are different measures and should not be conflated.
3. Make the deliverable auditable
The sheet lists the coordinate reference system and outputs such as orthophoto, elevation models, point cloud and 3D mesh, so the recipient knows which file is for viewing, which for measuring and which for later technical use.
4. Turn imagery into a measurable footprint
The same set of images moves from visible texture to relief. This supports documentation, inspection preparation, slope location and GIS layers; it is not automatically a legal survey, and admissible use depends on the control protocol.
5. Use each derived layer for its own question
Heights above ground, vegetation, slope, aspect, hillshade and contours are not six decorations of the same map. Each layer answers a different question and needs an explanatory caption rather than a silent stack of images.
Quality control changes the decision
All 21 photographs calibrated with 1.4 px reprojection error. The report also exposes its less favorable signals:
- ›Internal CE90: 11.2 cm.
- ›Internal LE90: 22.3 cm.
- ›62.4% of the area observed by at least three images, against an indicative 80% target.
- ›No ground control points.
These indicators do not make the result unusable. They define its responsible use:
- ›Site documentation and visualization: the output may be suitable.
- ›Relative measurements and intervention planning: check project tolerance against the observed control.
- ›High-stakes absolute positions or boundaries: use GCP, validated RTK/PPK or appropriate survey control.
What this case lets you decide
The report helps decide whether to accept the product to document the site, reacquire a weak sector or repeat the mission under a stricter control protocol. That decision is more useful than an abstract promise of high precision.
Request this type of analysis
Related drone operations
Sources
Public PDFs sample-drone-mission.{es,en,fr}.pdf, pages 1 to 13, edition generated on 2026-08-07. The five figures come from the public sample. Internal CE90/LE90 are never presented as guaranteed absolute accuracy, nor the 113 ha flight footprint as the 7.77 ha reconstructed area. Figures must be rechecked if these PDFs are regenerated.